


One software solution for all stages of your research

Survey programming
Import external data
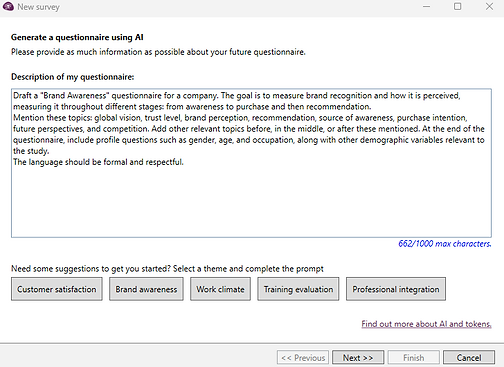
Import questions in an Office document or create a survey from scratch.
Get inspired with the help of AI and use its suggested questions specifically for your survey.
Design the survey with complete flexibility: place each element anywhere.
Create various survey designs to fit the different distribution channels: web format, smartphone format, or paper format.
Automatically translate surveys into more than 44 languages and create multilingual surveys.
Create rules for the way in which questions are displayed with logic conditions that range from the very basic to the highly advanced.

Check out some examples
Customer experience

Market research

360-degree feedback

Leading brands in various sectors already use Sphinx
"I feel very satisfied with the platform; it is very easy to use, and the support provided by the team is exceptional, always showing the best attitude and kindness when addressing my needs. In addition, I really value the webinars they share."
Consumer Research Analyst
"I would highlight the ease of learning and the significant time savings that using the survey creation and data analysis environments provides me."
Teacher and Researcher
"We have a strong online survey community in which Sphinx has been a key partner, providing us with valuable tools for its management and high-quality support, always offering quick responses and a friendly approach."
Research Manager
Survey distribution
Thanks to its multiple distribution channels and formats, Sphinx iQ is an advanced multichannel distribution platform suited to any type of project.
Market research: the high level of quota control required can be achieved by connecting with any external panel platform or managing your own panel directly from within the platform.
Automating the management of customer feedback: the platform combines various channels, has multiple language options, automates mass send-outs, sends reminders and generates email alerts about unsatisfied customers.
HR studies: the platform manages the anonymity and the different communication channels for the different staff profiles (young employees, employees without internet access, etc.) required by work environment surveys, 360-degree feedback, corporate culture surveys, etc.
Because each study is unique and has its own specific context, target group, and research protocols.

Data management
Import external data
External studies in CSV, XLSX, SPSS, and other formats
Interview transcripts (semi-structured, focus groups, etc.)
Historical data for comparison with a current study
Prepare data for analysis
Clean up the database (systematic responses, incomplete or duplicate entries…).
Calculate or recalculate new variables that would aid the analysis (e.g. extract age from a date, create a profile variable based on other variables, etc.).
Combine and transform variables by changing their format.
Manage the sample before analyzing the data (e.g. weighting, profiles, statistical units, etc.).
Translate and correct open-ended responses in other languages for further analysis.


Quantitative and qualitative data analysis
Drag and drop to analyze responses in real time


Statistical analysis
Descriptive analysis
Instantly generate tables and graphs according to the type of data (e.g. geographic maps, curves, histograms, heat maps, etc.) by dragging and dropping the variables.
Text analysis
Corpus analysis
Explore comments interactively through word clouds, contextualized comments, specific words for a given product/region/type of customer, etc.
Link analysis
Thematic analysis
Cross-reference variables and link data with dedicated statistical tests (e.g. Chi2, Fisher, correlation coefficient, etc.).
Go further with multivariate analyses: regression, AFC, ACP, structural equation modeling, etc.
Generate different response clusters: e.g. by using agglomerative hierarchical clustering, k-means, etc/
Compare averages and samples.
With Sphinx AI, you can automatically code and categorize all your comments into topics thanks to Artificial Intelligence.
With just two clicks, your corpus will be organized by themes and updated in real time.
Analysis specific to Customer Experience
Satisfaction KPIs: NPS, Customer Effort Score, Customer Satisfaction Score, etc.
Matrices for identifying the attributes that impact satisfaction and analyzing whether their influence is positive or negative.
Tables for studying strengths and weaknesses, comparative benchmark tables, etc.
Sentiment analysis
Automatically capture the tone of comments (positive/neutral/negative) thanks to the power of machine learning and combine it with the results of the thematic analysis to identify the topics that are talked about positively and negatively.
Data visualization


Create reports and infographics
Design a fully customized report, with icons, logos, text areas, shapes, images, etc.
Share it online and export it to Word, PPT, Excel, PDF
Create dashboards and control panels
Create a visual interface showing KPIs.
Set up interactive filters that work in multiple ways.
Data updated in real time.
Create profile-based dashboards so that users can only access the data for their profile (e.g. according to department, branch, position in the company, etc.).


Combined, all of the above functions allow you not only to manage any ad hoc study from A to Z, but also to set up extremely advanced measurement and data management systems.
One tool to do it all


